
- Explore & Connect
Join Our Community
Welcome to our vibrant trading community — a space where traders from all levels connect, learn, and grow together. Discover powerful tools, real-time signals, and exclusive strategies shared by top-performing traders. Dive into a world of social trading and unlock the power of shared knowledge.
Social Trading Tools
Stay connected with our powerful tools designed to let traders share, learn, and grow together. Discover strategies, market insights, and community-driven support in real-time.
Trader Rankings
View top-performing traders in our live rankings. Analyze their success, follow trading behavior, and gain valuable inspiration from the best in the community.
Copy Signals
Easily copy trades from experienced traders. Save time, reduce risk, and follow proven setups with just a few clicks using our built-in signal sharing.
- Smart Tools
Indicators and strategies
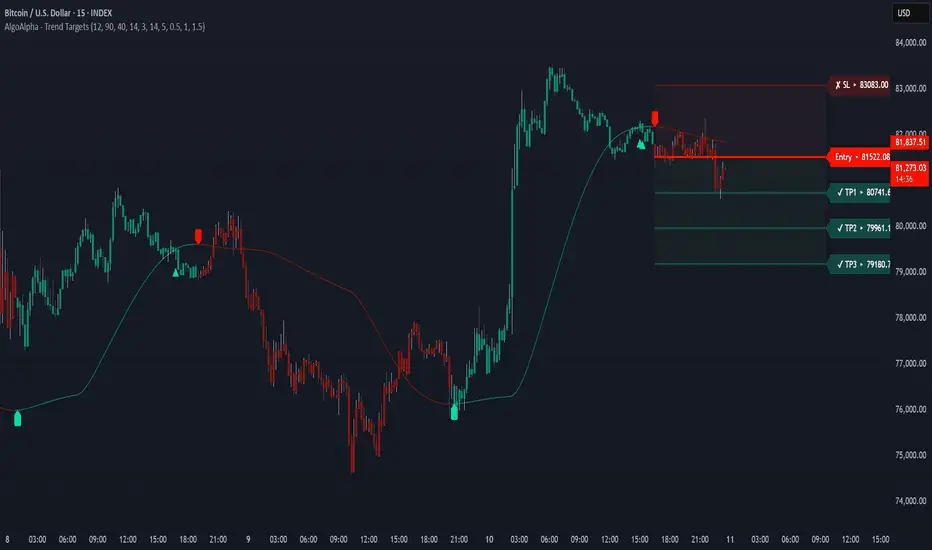
Trend Strategy Targets of profit and loss
In trend-following strategies, profit targets are typically set using predefined risk–reward ratios—often 1:2 or 1:3—so that potential gains justify the risk taken. These targets can also align with key technical levels such as prior swing highs, Fibonacci extension zones, or measured moves from breakouts. For stop losses, you generally place them just beyond the most recent swing low (for longs) or swing high (for shorts), adjusting for market volatility with tools like the Average True Range (ATR) to avoid getting stopped out by normal price noise. To optimize trade management, many traders then transition to ATR-based or trendline-based trailing stops, which lock in profits as the trend matures while still allowing room for healthy pullbacks.
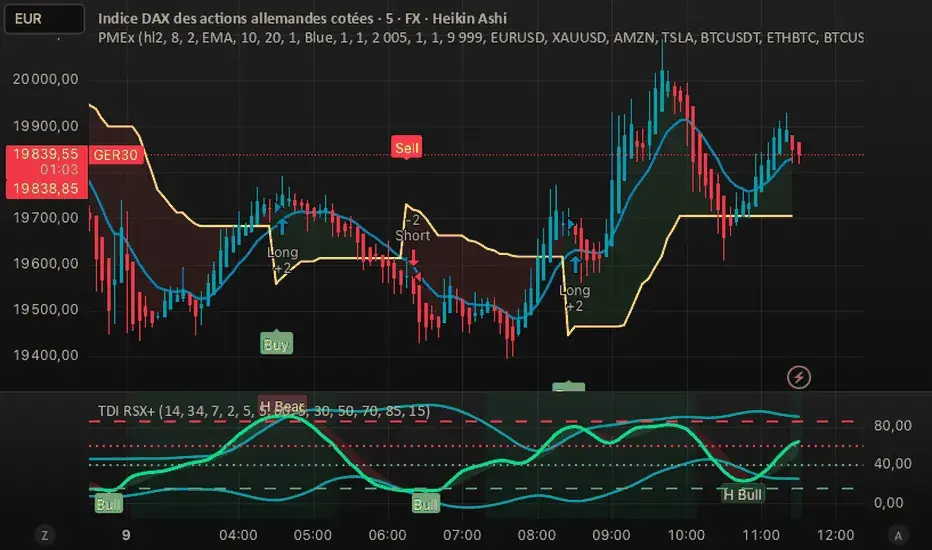
TDI - RSX + Divergences + Pivots
TDI – RSX + Divergences + Pivots is a composite algorithmic indicator that builds on the classic Traders Dynamic Index by swapping its standard RSI for the smoother Jurik RSX oscillator, adds volatility bands and signal-line crossovers for trend/momentum, and then layers on two more tools: automatic detection of divergences between price and the RSX to highlight weakening or strengthening momentum, and plotting pivot points (derived from prior highs, lows, and closes) as dynamic support and resistance zones. In an algo-trading system, you can use it as a multi-factor signal generator—entering long when a bullish RSX divergence unfolds near a pivot support level and the RSX line crosses above its signal line (and vice versa for shorts)—while the pivot levels feed directly into your stop-loss and take-profit rules for fully systematic, data-driven trade execution and risk management
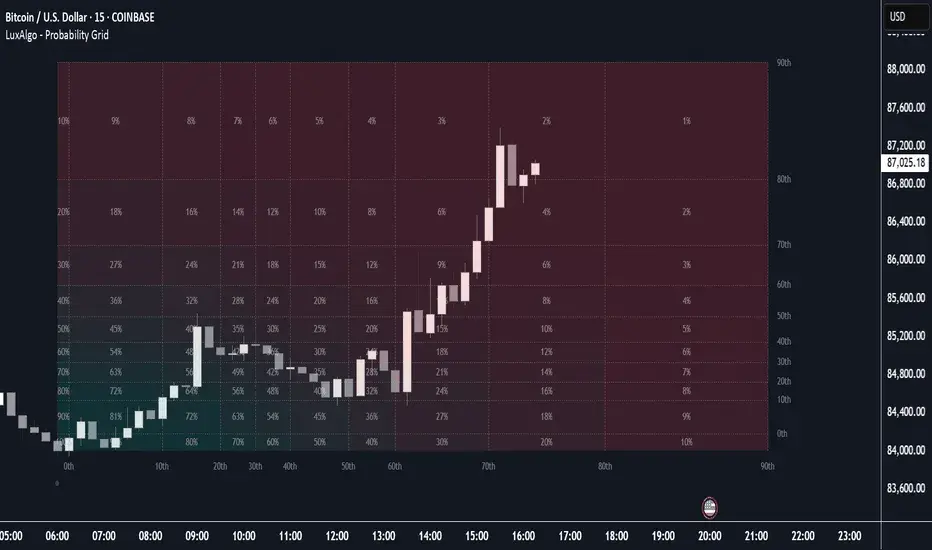
Probability Grid
A probability grid in algorithmic trading is a two-dimensional matrix that quantifies the likelihood of an asset’s price reaching or reversing at various levels within specified timeframes. Traders build this grid by applying statistical techniques—such as historical distribution analysis or Monte Carlo simulations—to calculate probabilities for discrete price bands and time horizons. Displaying these probabilities in a structured grid helps automated strategies calibrate entry and exit thresholds, set dynamic risk controls, and adapt to changing market volatility in real time. By visualizing the chance of different market moves across a grid, traders can design more systematic, data-driven approaches that improve execution timing and risk management
Trend Targets [AlgoAlpha]
Lorem Ipsum has been the industry’s standard dummy text ever since the 1500s, when an unknown printer took a galley of type and scrambled..
Trend Targets [AlgoAlpha]
Lorem Ipsum has been the industry’s standard dummy text ever since the 1500s, when an unknown printer took a galley of type and scrambled..
Trend Targets [AlgoAlpha]
Lorem Ipsum has been the industry’s standard dummy text ever since the 1500s, when an unknown printer took a galley of type and scrambled..
Start Your Trading Journey
Join thousands of successful traders and take control of your financial future.